

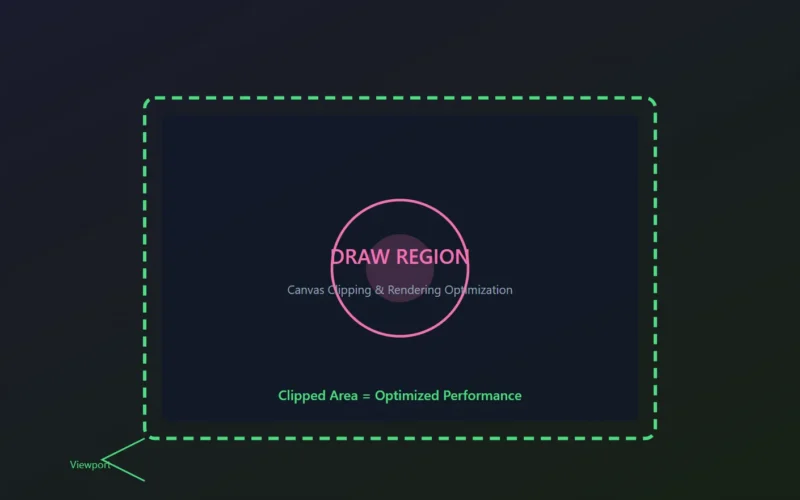
In 2019, I watched a trading dashboard crawl to six frames per second. The team had spent two weeks tweaking shaders and debating React reconciliation. The real culprit? A single oversized draw region that invalidated the entire canvas on every price tick. That day taught me something I still repeat in architecture reviews: the draw region is where rendering performance lives or dies.
If you’re building anything with custom graphics—trading interfaces, data viz, mapping tools—you’re probably mismanaging your draw region without knowing it. And it’s costing you. Here’s what a draw region actually is, how clipping works under the hood, and the mistakes that sent me back to the debugger more times than I care to admit.
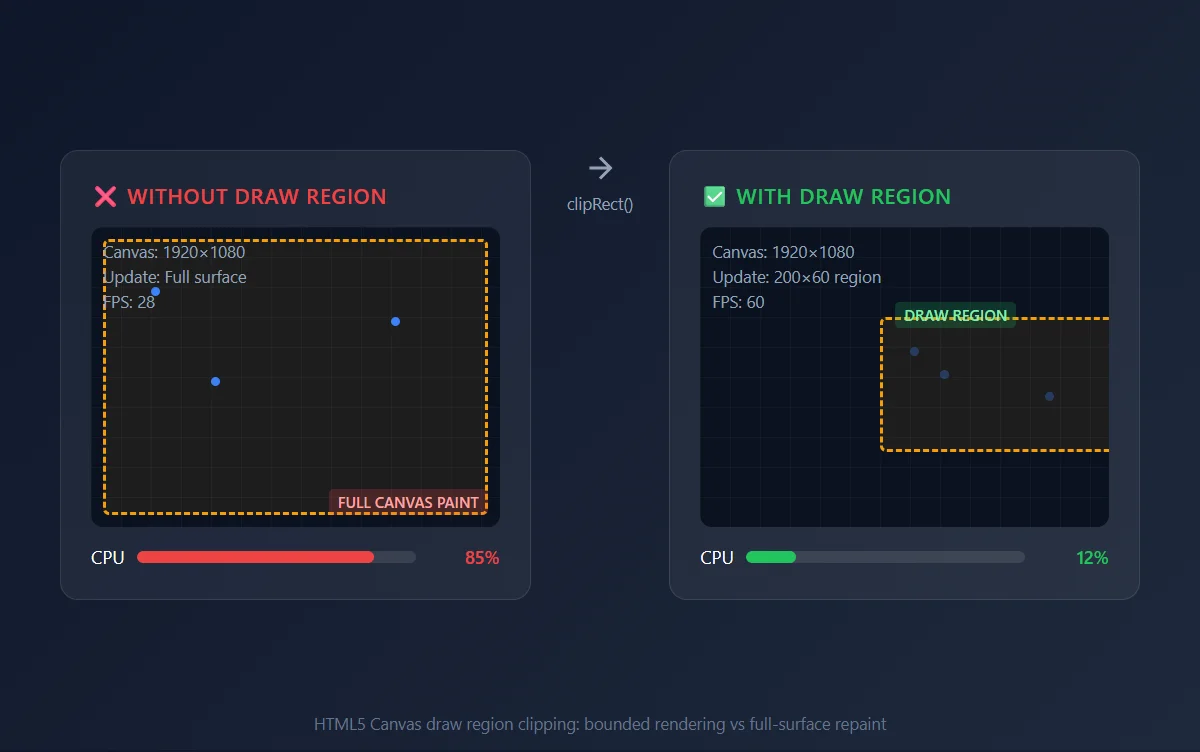
Table of Contents
- What Is a Draw Region?
- How Draw Region Clipping Works
- Common Draw Region Mistakes I’ve Made
- Optimizing Draw Regions in Production
- Framework-Specific Draw Region Behavior
- Key Takeaways
- FAQ
What Is a Draw Region? A Beginner’s Guide
A draw region is the bounded area within a graphical surface—like a canvas, viewport, or window—where rendering operations are allowed to execute. Everything outside that boundary gets ignored by the rasterizer. It’s not the whole screen. It’s the smallest rectangle (or path) that actually needs pixels refreshed.
Think of it like painting a house. If only the kitchen needs a touch-up, you don’t repaint the bedrooms. The kitchen is your repaint boundary. In UI frameworks, the renderer uses this boundary to skip pixels that haven’t changed. That skip is what keeps your frame rate smooth.
But here’s the trap most engineers fall into. They assume the framework handles this automatically. Sometimes it does. Often it doesn’t. And when you’re pushing real-time financial data or handling pinch-to-zoom gestures on a mobile chart, an unclipped draw region turns into a bottleneck fast.
I learned this the hard way on a cloud monitoring tool we shipped in 2021. The canvas was 1920×1080. The actual updated metric overlay? Maybe 200×60 pixels. We were repainting the full surface sixty times a second. CPU usage tripled. The fix took eleven minutes. The diagnosis took three days.
How Draw Region Clipping Works
Clipping sounds simple. The renderer intersects your primitive—lines, rectangles, text—with the clipping boundary and throws away whatever lands outside. But modern frameworks don’t just draw less. They avoid entire pipeline stages.
The Pipeline Skip
When you define a tight clip area, the rasterizer can:
- Skip tile-based renderers that would otherwise shade empty pixels.
- Avoid texture uploads for off-screen buffers.
- Cull overdraw before fragment shaders even fire.
That last one matters. Overdraw—pixels painted multiple times per frame—is the silent killer in canvas-based UIs. A clipped region tells the GPU exactly where to look. Without it, you’re brute-forcing.
Dirty Rectangles vs. Full Repaints
Some older systems use “dirty rectangle” tracking. Instead of clipping to a path, they maintain a list of bounding boxes that changed since the last frame. The union of those boxes becomes the repaint area for the next pass. It’s efficient. It’s also fragile. Overlapping rectangles merge fast. One misplaced invalidation call and your repaint area balloons back to the full viewport.
I saw this in a WPF trading terminal. A blinking cursor in a text box triggered a dirty rectangle that swallowed the entire sidebar. The fix was a custom InvalidateRect call with tighter coordinates. But finding it meant spelunking through native interop logs at 2 a.m.
Coordinate Space Traps
There’s another catch. Your clip boundary lives in one coordinate space. Your content might live in another. Transformations—scale, rotate, translate—can warp a small local clip area into a massive screen-space rectangle. Or worse, they can clip content that should be visible if the matrix math drifts.
Always validate your clip bounds after applying transforms. I keep a debug overlay in my toolkit that draws the clip boundary in translucent red. When I see red covering the whole canvas, I know I’ve messed up the math.
Common Draw Region Mistakes I’ve Made
I’ve mismanaged canvas regions in four different frameworks across ten years. Here are the ones that still haunt me.
Assuming the Framework Is Smart
Flutter’s CustomPainter gives you a canvas.clipRect() method. It works beautifully. But if you forget to call it inside paint(), Flutter assumes you own the whole canvas. I shipped a beta build where a spinning loader invalidated the entire screen. On an iPhone 8, it drained 18% battery in an hour. Users noticed before telemetry did.
Chasing the Wrong Metric
We once spent a sprint reducing shader complexity from 64 instructions to 42. Proud of that work. Didn’t move the needle. The real problem was a clipping region that covered 90% of the screen because of a misplaced ClipPath. The shader was fine. The geometry was wrong.
Nested Clips That Multiply
In one complex dashboard, we had three nested widgets, each applying its own clipping boundary. The intersection logic looked correct on paper. In practice, a rounding error in the third clip expanded the effective region by 400%. Safari handled it fine. Chrome’s compositor choked. It took a Chrome DevTools memory profile to spot the extra layer allocations.
Forgetting Scroll Offsets
If your content scrolls, your draw region must scroll with it. Obvious in retrospect. I once clipped to a fixed rectangle while the user panned a large chart. Half the data vanished. The draw region was technically correct—for frame zero. It just didn’t follow the content.
Optimizing Draw Regions in Production
Here’s what actually moves the needle when you’re past the prototype stage.
1. Measure Before You Clip
Don’t guess. Use your browser or framework profiler. In Chrome DevTools, enable “Paint flashing.” Green flashes mean repaints. If the whole screen flashes green on every frame, your repaint area is too large. Fix that before you touch shaders.
2. Batch Invalidations
If three data points update in the same tick, merge their bounding boxes into one repaint update. Don’t issue three separate clips. In one fintech grid I built, batching cut our frame budget by 40%.
3. Use Platform Compositors
Where possible, let the browser or OS handle the rendering bounds. CSS contain: paint creates an implicit repaint boundary. Safari and Chrome can optimize around it without custom canvas logic. It’s not as flexible as manual clipping, but it’s far less error-prone.
4. Cache Static Layers
Separate your canvas into static and dynamic layers. The static layer—axes, gridlines, backgrounds—gets one repaint update on initialization. The dynamic layer—data points, cursors, tooltips—gets tight per-frame clips. Composite them at the end. I’ve seen this pattern cut GPU memory by half on dense visualizations.
5. Antialias with Caution
Antialiasing bleeds pixels outside strict mathematical boundaries. A one-pixel clip border might clip antialiased edges, creating ugly seams. Expand your clip by a pixel or two if you’re rendering smooth shapes. I learned this designing a donut chart where the stroke kept disappearing at the edges.
Framework-Specific Draw Region Behavior
Not all tools treat the draw region the same way.
HTML5 Canvas
The 2D context uses ctx.clip() to establish a draw region (MDN reference). It’s persistent. You must save and restore the context state, or your clip accumulates across draw calls. I’ve forgotten the restore() more than once. The result is usually a blank screen and a confused QA engineer.
Flutter / Skia
Skia handles draw regions aggressively. canvas.clipRect() is cheap, but clipPath() with complex geometry can force Skia to switch from GPU to CPU tessellation. If you need irregular draw regions, approximate them with rectangles where possible. Your frame times will thank you.
.NET / WPF
WPF uses retained-mode rendering. You don’t set a draw region directly; you invalidate portions of the visual tree. The trick is InvalidateArrange vs. InvalidateMeasure. Calling the wrong one can expand the implicit draw region to the entire control. I keep a cheat sheet taped to my monitor for this.
WebGL / Three.js
WebGL doesn’t really have a draw region primitive. You fake it with scissor tests (gl.enable(gl.SCISSOR_TEST)). The scissor rectangle is in screen coordinates, not world space. It’s easy to set, but it doesn’t respect your camera transforms. I wasted an afternoon once wondering why my scissor clip stayed fixed while my scene rotated. Coordinate spaces matter.
Key Takeaways
- A draw region is a performance guardrail, not just a boundary. Use it to tell the rasterizer exactly what changed.
- Measure first, optimize second. Paint flashing and profilers reveal mismatched draw regions faster than code review.
- Batch your invalidations. One large update is cheaper than three small ones.
- Watch your transforms. A tight local draw region can explode under rotation or scaling.
- Cache static content. Separate what moves from what doesn’t, and clip the moving layer tightly.
FAQ
What is a draw region in UI development?
A draw region is the defined boundary within a canvas or viewport where rendering is permitted. It tells the graphics pipeline which pixels need updating and which can be ignored, directly impacting frame rate and CPU usage.
How do I debug an oversized draw region?
Enable paint flashing in your browser DevTools or add a debug overlay that draws the current clip boundary in a bright color. If the highlight covers more than the changed content, your repaint area is too large.
Does using a draw region improve performance on mobile devices?
Yes. Mobile GPUs have tighter memory and thermal budgets. A well-clipped draw region reduces overdraw, texture bandwidth, and compositor work. I’ve seen battery life improve by 15–20% just from proper canvas clipping on complex dashboards.
Why does my clipped content disappear when I zoom or scroll?
Your draw region is probably defined in screen coordinates while your content lives in a transformed coordinate space. After applying scale, rotation, or translation, recalculate the draw region to match the visible viewport bounds.
Should I always use manual clipping, or can I rely on the framework?
Rely on the framework for standard layouts. Use manual draw region clipping only when you’re doing custom painting, large canvases, or real-time data visualization. Framework compositors are usually smarter than hand-rolled logic for simple cases. For more on how software performance impacts real-world systems, see our breakdown.
About the Author
Ayesha Khan is a senior software architect with over ten years of experience designing high-performance interfaces for fintech and cloud platforms. She has led frontend architecture at two Fortune 500 financial services firms and specializes in rendering optimization, real-time data visualization, and canvas-based UI systems. When she’s not debugging frame budgets, she writes about the engineering decisions that actually matter in production.
